Running a TFA Nexus weather station under Linux
First beginnings
After having had a "weather station" for some
years that showed the outside temperature, barometric pressure,
inside temperature and some corresponding minimal and maximal
values, I decided that I needed something more “geeky”, something
that can be analyzed afterward on a PC.
Requirements were easy to describe: Must have sensors for
temperature, wind and rain and must be usable under Linux.
Finding the software part was easy: There seems to be nothing else
in the open source world
but wviewweather.
This package was written and is maintained by Mark S. Teel.
I'd like to thank Mark for his excellent work once again.
Next task was to find a not too expensive weather station
available in Germany and supported by wview. I wasn't really sure
if the TFA Nexus
(Kat. Nr. 35.1075)
was indeed one of the wview's supported ones named as “nexus” - a
Honeywell TE923 clone.
I gave it a try and I was not disappointed.
The TFA Nexus is fully supported from wview.
No problems at all to get it running.
Modifying wview
Once I got my new TFA Nexus running with wview I realized some
strange divergence between the rain amount shown on the Nexus base
station and in wview's display.
So I installed the wview sources, compiled everything myself,
added lots of trace output just to find out: The Nexus doesn't
report the millimeter amounts shown on the display, but the raw
ticks sent by the rain sensor.
That was the beginning of "jo's-te923-hack" of wview.
Getting help
Send me an email to jo639@sommrey.de
if you have any questions or suggestions or if you found a bug.
The te923-hack
Preface
Applying this patch requires some knowledge of building packages
from source, resolving missing dependencies and other stuff.
If you are not familiar with this process: Hands off!
The changes from this patch are neither bug fixes nor improvements to
wview. They are just modifications that I regard as useful for
me, but that will definitely break some other people's installation.
I do not intend to make this patch part of the mainline code.
They are in no way meant as criticism of Mark's work.
I just took the liberty of modifying wview for my personal use.
If you use this patch (or parts thereof) and experience any kind
of trouble, remember: before reporting bugs to Mark, make sure
they are reproducible in the un-patched version of wview.
Rain
The rain measurement was my primary motivation to make some
changes to wview.
There was not really something to patch.
The station reported “ticks” that were interpreted as millimeters.
By setting the corresponding multipliers (rain and rain rate) to
0.70555556 (1/36 inch) this issue was almost resolved.
However, from the conversion from millimeter to inches and back to
millimeter inside wview, there was some precision loss.
Therefore I changed this rounding in my patch.
I'm not sure if this is really needed, but it doesn't harm.
Please note that the rain tick amount of 1/36 inch is still a guess.
But it seems to fit.
Wind
As a wind force illiterate and a German native speaker I felt kind of
uncomfortable with the verbal descriptions of the wind strength on the
“weather summary” page.
Therefore I added the numerical
Beaufort
scale values to the “Recent Beaufort Scale” shown on there.
Wind speed and wind gust speed reported from the station with one
digit after decimal point, but are stored as integers.
Converting these to mph and back to km/h results in rather
step-like plots.
Changing the data type to float improved this a lot.
Wind chill
The wind chill is discontinuous if the formula
is applied for values of temperature and windspeed strictly in the
range temperature < 50 F, windspeed > 3 mph.
Extending the range to where windchill equals temperature
makes the function continuous in both arguments.
Finding these points isn't too hard in algebraic terms.
However, I did this using wxMaxima, the script containing all the
steps you may find here.
Anemometer windchill and temperature
The anemometer is equipped with a temperature sensor that
is used to
calculate wind
chill.
This value is contained in the data block sent by the station.
Wview doesn't even decode it.
To make use of this value I put the anemometer's wind
chill into the extraTemp2.
Extending the wind chill calculation as described above opens a
way to revover the temperature measured at the anemometer from the
station's transmitted wind chill and the one calculated within
wview.
Given a wind chill difference based on the same wind speed it is
possible to calculate the difference of the underlying
temperatures.
The calculated anemometer temperature is stored as extraTemp3.
Sun duration
As the TFA Nexus doesn't have an UV sensor, I disabled the
reading of it and "freed" the UV field thereby.
Putting the difference between the calculated anemometer's
temperature and the standard outside temperature into the
otherwise unused UV field offers a way to measure sunshine
duration.
Adding up the time when this value is above e.g. 2.8 K gives a
good estimate of the sunshine duration.
Changing the content of UV to a temperature difference required
some modifications in graph generation.
Heat index
As with wind chill, the heat index is discontinuous when the heat
index formula is used strictly for for temperatures above 75 F.
Moreover, the heat index may even go below the outside
temperature.
A detailed investigation of the heat index formula yields:
the function can be divided in three parts, depending on the
humidity
- for very low humidities (h < 44.6 %), the
calculated heat index and the temperature intersect at a
certain point above 82 F.
- for medium humidities (44.6 % < h < 81 %), there is
no intersection between these two curves.
In the range 73 F - 82 F there is a point where the difference
becomes minimal.
- for higher humidities (h > 81 %) there is again
an intersection in the range 73 F - 77 F.
The calulation of these special points is somewhat difficult in
algebraic terms.
There are numerical estimates for 10 % ≤ H ≤ 100 %
in heatindex.h.
Using these numbers as the switching point from hi = T to the
calculated value makes the function partly continuous and
minimizes the step where it cannot be made continuous.
The limits were calculated using wxMaxima and stored
in common/heatindex.h
Curve analysis and header file generation was again done using
wxMaxima.
The script to reproduce you can find here.
Be aware that running this Maxima program will generate a file
named heatindex.h in your current directory.
Station data logging
To get a better understanding of the data sent by the weather
station via USB, I added log entries for the data blocks sent by
the device.
This data may be decoded with something like perl.
Look at te923Protocol.c for details.
Extra temperature recording
From the 5 possible temperature sensors only the first is recorded
in the database.
Since I have a second temp/humid sensor in use, I wanted to
record these values too for further processing.
The patch makes the values of an additional sensor on channel 2
available as extraTemp1/extraHumid1 in the database.
Sensor status
The status of the outtemp, wind, rain and secondary outtemp
sensors are put into the database
fields OutTempBatteryStatus,
windBatteryStatus, rainBatteryStatus
and txBatteryStatus.
Virtual station
If your station is connected to some small device like a
BeagleBoard or a RaspberryPi, you might want do access the station's
data via the "virtual" station from a bigger iron.
Not all available data are transferred via the virtual station and
there are some specialties regarding NULL values.
The te923-hack makes some modification in this part.
Download
Apply the te923-hack
against wview-5.20-2 source and rebuild.
Wview has advanced since the days when I created my modifications
but as I always felt comfortable with the version I'm using, I never
upgraded to a newer one.
The original sources for 5.20.2 may be hard to find.
Therefore you can find them here:
wview-5.20.2
Extending archive data
There are a few simple steps to activate additional values in
the sqlite database.
(That is: populating an existing column, not adding a new one.)
- Make sure the required value is provided by your station and
gets decoded.
Look at your_station
Protocol.c
- Make sure the decoded value is written to
the
LOOP_PKT structure
in your_stationProtocol.c
- Copy the data from the
LOOP_PKT structure into
the ArcRecStore in computedData.c.
That's all.
Database plotting
Wview comes with some utilities for exporting
the data contained in
the sqlite database
to mysql.
Based on this exported data I wrote some small programs to
evaluate it.
They are mostly dependent on each other but may be used
independently with some modifications.
Export to mysql
Follow the steps described in the wview user manual to export your
data to mysql.
For the time being there's a bug
in wview-mysql-export that prevents it from exporting
noaa data after the initial export is done.
Here is a modified version of this script that has a fix for this
issue and behaves a little bit more robust in general:
wview-mysql-export
Metric database views
After importing the sqlite data into mysql you get a one-to-one
copy of the data.
That is: Unix time stamps and US units.
With a small set of mysql stored functions you may define database
views that have convenient database time stamps and metric units.
Run Metric-views as SQL
script against your wview database.
This will create views named table_m for all
relevant tables.
The same should be possible with the sqlite database without prior
export to mysql.
As I have all my databases running in mysql, I wanted to store the
weather data there, too.
Moreover I didn't want to make any changes in wview's databases.
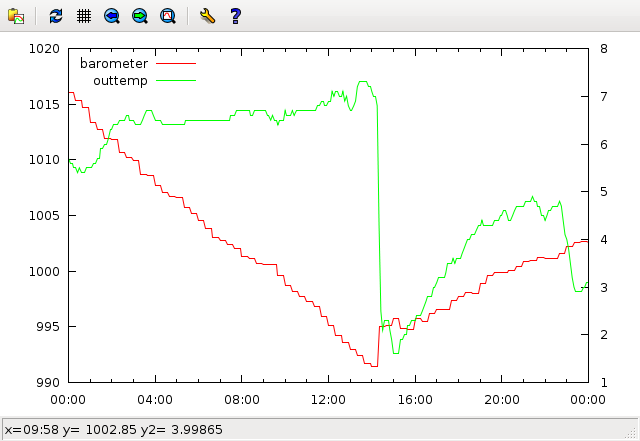
Perl wrapper for gnuplot
With the perl
program weatherplot you can extract data from mysql
and feed it into gnuplot.
This may be used to visualize many combinations of one value
against another.
You can even plot more than two fields at the same time as long as
they share units.
Provide the mysql account data at the top of the script.
For usage details see perldoc weatherplot.
Store Weatherplot
as /usr/local/bin/weatherplot and make it
executable.
Here is a screenshot of a simple plot:
CGI scripts for weatherplot
The next step are two
perl
cgi-scrips weather and weatherplot
that provide a web interface to the gnuplot generated images.
The values that are selectable from this page are derived from the
gnuplot wrapper script weatherplot.
There's a list of valid names at the top of the script that you
may modify to your needs.
An example of an apache
config file is provided too.
Store Weatherplot-cgi
as /usr/local/lib/weatherplot/weatherplot
Store Weather-cgi
as /usr/local/lib/weatherplot/weather
Store weatherplot.conf
as /etc/apache2/conf.d/weatherplot
Modify the apache configuration to your needs.
In the form given it makes the weatherplot interface accessible
as /weatherplot/
or /weatherplot/weather.
Here's a screenshot of the web interface:
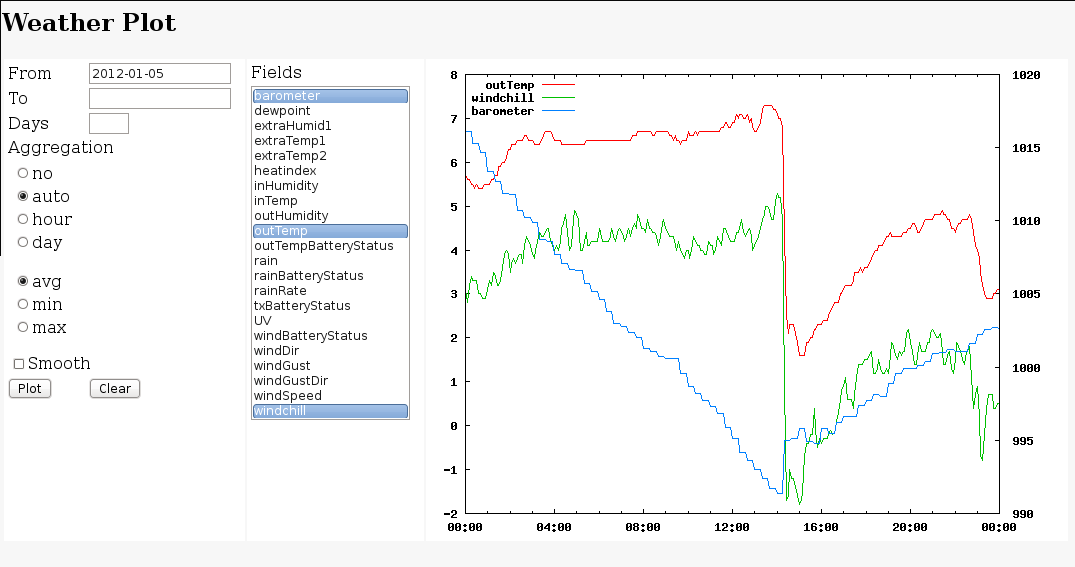 If aggregation is set to "auto", no aggregation will be done for
an interval of up to 3 days, hourly aggregation for intervals
longer than 3 days up to one month and daily aggregation for even
longer intervals.
The From: and To: fields can be left blank or must be given in one
of the formats "yyyy-mm-dd" or "yyyy-mm-dd HH:MM:SS".
See
If aggregation is set to "auto", no aggregation will be done for
an interval of up to 3 days, hourly aggregation for intervals
longer than 3 days up to one month and daily aggregation for even
longer intervals.
The From: and To: fields can be left blank or must be given in one
of the formats "yyyy-mm-dd" or "yyyy-mm-dd HH:MM:SS".
See perldoc weatherplot for a more detailed
description of these fields and their defaults.
Adding METAR based values
There is some weather data that a common station won't be able to
measure, especially clouds and visibility.
You may add tags of the form <!--METAR:tag--> to your
page templates and let metar-subst.pl
substitute these with decoded METAR information.
To do so, install the script in /usr/local/bin.
Install the
Geo::METAR perl module.
Set up a cron job to download the METAR data from your nearest
station into /var/lib/wview/img/metar.txt using the
metar program.
Finally add this line to
/etc/wview/post-generate.sh:
/usr/local/bin/metar-subst.pl <list of pages>
with the pathes to all pages that are to be processed.
The script metar-subst.pl does some modifications on the data
returned by Geo::METAR:
It converts heights in feet to meters, it changes "meters" to "m"
for visibility distances and it changes the "magic" 9999 m visibility
to "> 10 km"
Other things to consider
Finally I wanted to change and extend the html pages generated by wview.
This led me to something completely new: a AngularJS based single
page application that shows modified data "on the fly".
If someone is interested in this stuff, don't hesitate to contact me.